- Home >
- Facilities Management
- > Utilities Costs & Consumption
Utilities Costs & Consumption
Reporting by Graphs
Utilities Expenditure Projection
NES Power Usage FY 08 vs FY 09
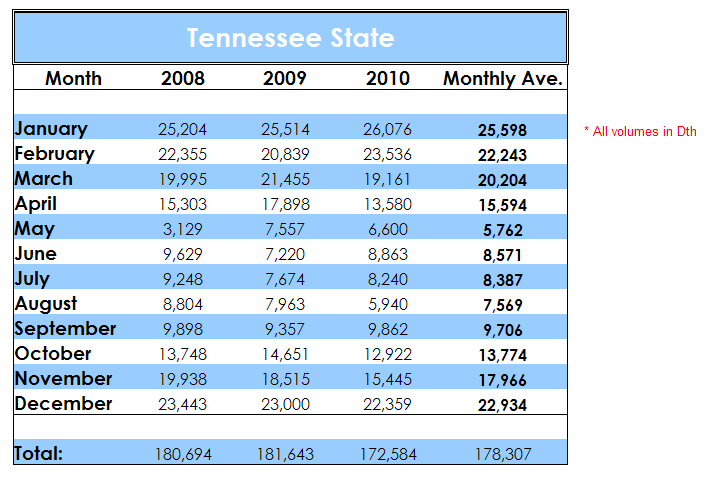
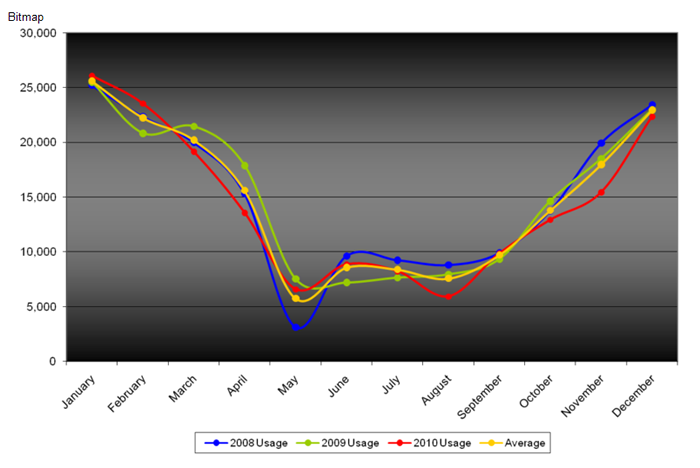
NATURAL GAS USAGE 2008-2010
< RETURN TO TOP >
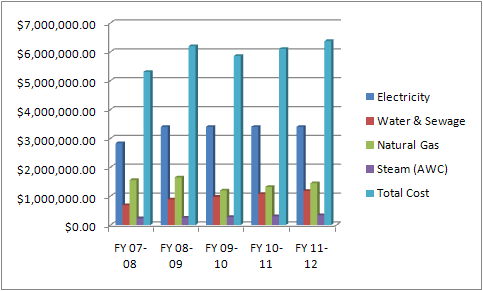
UTILITIES EXPENDITURE PROJECTION
Notes:
1. Electricity for FY 09-10 10-11 11-12
are based on no rate increases over FY 08-09 rates
2. Water and sewage
projections are based on 10% per year increases
3. Natural Gas FY 09-10 is
based on locked in pricing FY 10-11, 11-12 are based on 10% yearly rate increase
4. Steam is based on 10% per year increases
< RETURN TO TOP >
NES POWER USAGE FY 08 VS FY 09
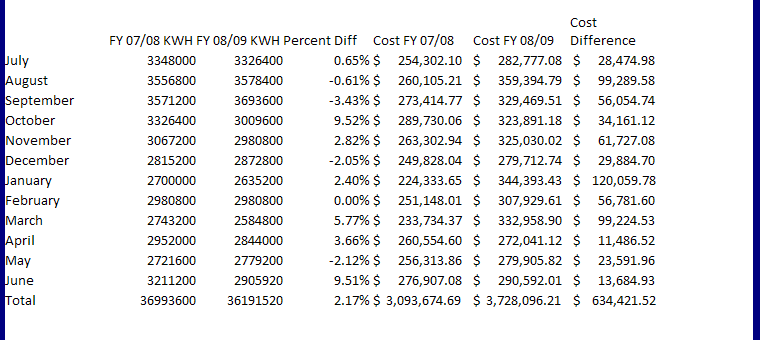
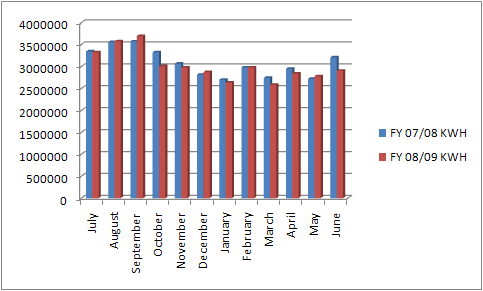
Note: May and June FY 08/09 are based on previous year usage with no reduction
< RETURN TO TOP >
webpage contact:
Facilities Mgmt


