


- Home >
- Psychology
- > Student Admissions, Outcomes, and Other Data
Student Admissions, Outcome, and Other Data
Student Admissions, Outcomes, and Other Data
Program Disclosures
Time to Completion for all students entering the program

Program Costs

Internship Placement - Table 1

Internship Placement - Table 2

Attrition

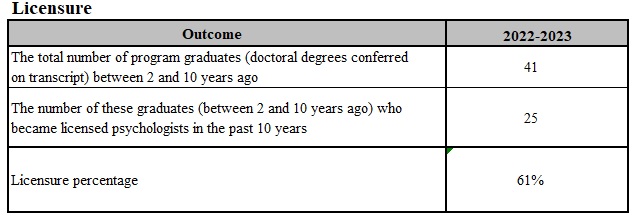
Licensure
Diversity
Currently, 65% of our students are culturally diverse based on APA's descriptors of diversity. Furthermore, many of our students are interested in diversity issues as illustrated by their choices of research topics, electives, and participation in select research teams.
Student Support in Doctoral Counseling Psychology Program
If a student has a Graduate Assistantship (GA) out-of-state tuition fees will be waived and in-state tuition fees will be applied. The amount of available funding within the Department for assistantships varies by year, but priority is given to students in the first year of their doctoral training. Research assistantships are available to our students through grants in other departments such as the Center for Health Research. Other forms of funding include adjunct teaching within the psychology department. Faculty are encouraged to include assistantships for doctoral students in all grants written within the area.
The majority of students interested in financial support as a graduate assistant through the university take advantage of the opportunity of teaching at the undergraduate level and/or collaborating in research with the faculty as a graduate assistant or as an adjunct instructor to the undergraduate program.
webpage contact:
Psychology